Data is 90% of truth if you are back- or forward testing. You need to have Data from reliable source. I want to introduce you how you can export Tradestation/Multicharts data with Easylanguage and import it into StrategyQuant
Howto Export in proper format
I had introduced fastappender in my previous posts, we will use this in order to archive speed. You could of course also skip this and modify my code to use Fileappend command, it would work but just very slow.
We will export the data as .csv format with ‘;’ seperation. Format will be Date;Time;Open;High;Low;Close;Volume
Inputs: ExportDirectory("c:\DATA1\");

Vars: OHLC("");
Vars: intrabarpersist FN(""),BInterval(0),intrabarpersist fa(0),string thetime("");

// External Definitions
external: "fast_appender.dll", int, "faInitA",LPSTR,int;
external: "fast_appender.dll", int, "faAppendA",int,LPSTR;

Once Begin
	if BarType=1 then BInterval=BarInterVal;
	if BarType=2 then BInterval=24*60;
	if BarType=3 then BInterval=24*60*7;
	if BarType=4 then BInterval=24*60*30;
	If BarType=12 then BInterval=(Range/1 Point);
	FN=ExportDirectory+getsymbolname+"-"+Numtostr(BInterval,0)+".csv";
	fa=faInitA(FN,1);
end;

// Adjust time to HH:mm format
if (time>=1000) then	thetime=numtostr(time,0)   else
if (time>=100)  then    thetime="0"+numtostr(time,0) else
if (time>=10)   then  thetime="00"+numtostr(time,0) else thetime="000"+numtostr(time,0);
thetime=midstr(thetime,1,2)+":"+midstr(thetime,3,2);


OHLC=ELDateToString(Date)+";"+thetime+";"
		+Numtostr(o,6)+";"
		+Numtostr(h,6)+";"
		+Numtostr(l,6)+";"
		+Numtostr(c,6)+";"
		+Numtostr(Volume,1)+Newline;

faAppendA(fa,OHLC);
The output looks like this:

Volume is 0 because it is forex symbol, this code can export any symbol. This code assumes you have c:\DATA1\ directory exists, if not you can adjust this directory by Input parameter in Easylanguage code. Now we have a valid .csv file of 1 month
Import Custom Data into StrateyQuant
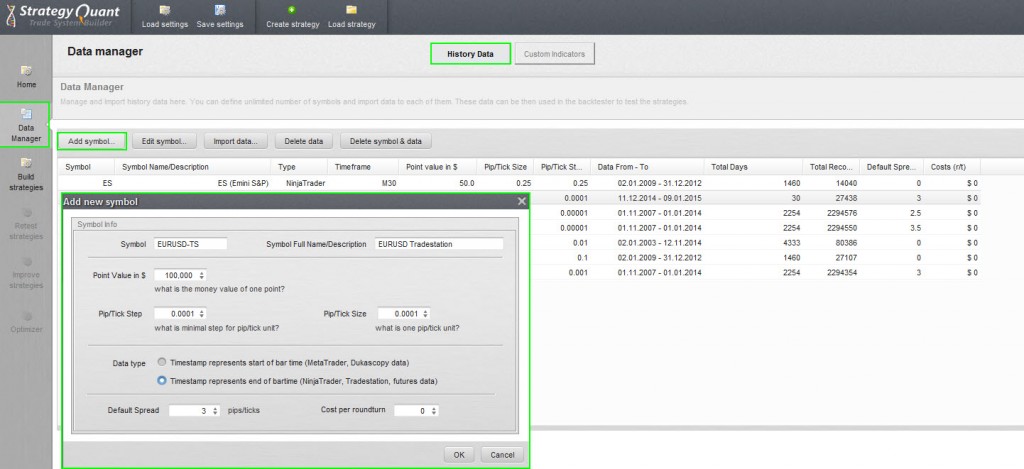
Start StrategyQuant, Click to Data Manager, make sure you are inside “History Data”, click to “Add Symbol”. You need to know the properties of Symbol you are importing. Especially Data type is very important.

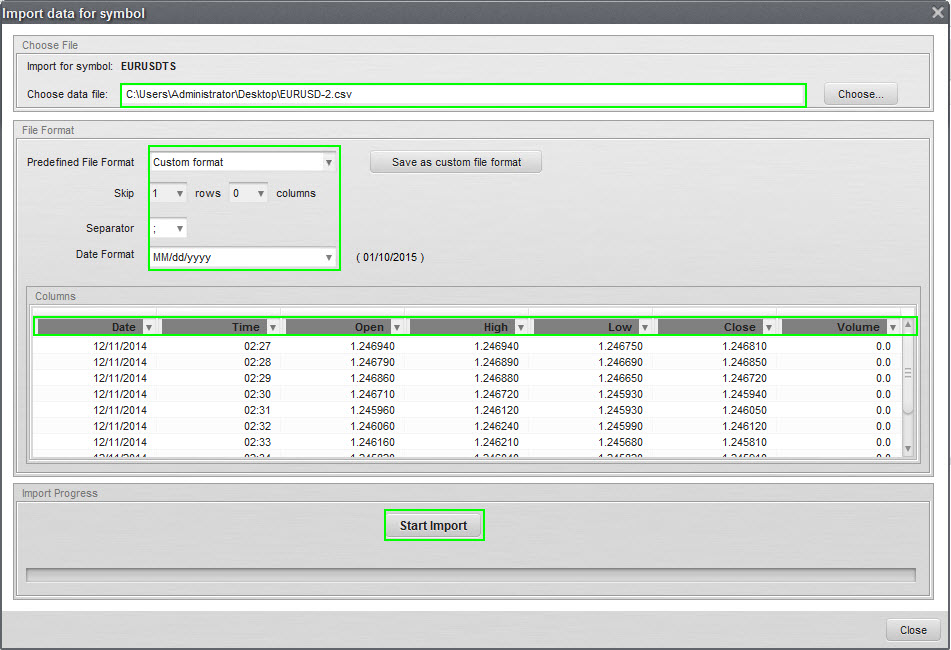
This step has added a new symbol into Strategy Quant. Now we need to add Data to that recently added Symbol, to do this you first select new symbol and click to “Import Data” button.
Select Fileformat as shown on picture and make sure columns are labelled like seen on picture and press Start Import. StrategyQuant will confirm how many bars have been imported and you will have new data available:

Important
Version 3.8 does not support Tradestation Data compression into other Timeframes. They plan to support automatically create other Timeframes automatically. But for 3.8 version you have to import every Timeframe manually.
