
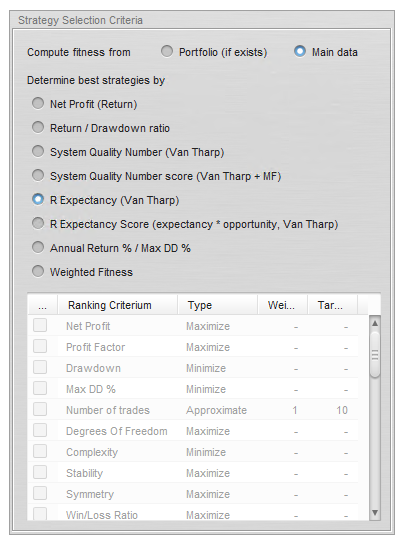
Did you ever think what is the “best” ranking selection criteria in StrategyQuant to build your selected strategies? This is an essential question because StrategyQuant searches millions of strategies and ranks top x ordered by your ranking criteria. So imagine there might be 100k possible strategies profitable (Profit > 0) but only top x will be listed to choose from. You need to skills to pick right criteria and read the picture properly for success in trading.
Getting Started
I have started a test which took me several days to determine and understand differences between ranking options. Of course you need to read about difference strategy selection criteria methods technically but i made following test:
I took very accurate Forex Data from Tradestation of single Symbol (GBPUSD) and let run StrategyQuant seveal times with different runtime and selection criteria. I have tested “Return / Drawdown ratio”,”System Quality Number score (Van Tharp + MF)”,”Net Profit” and “R Expectancy (Van Tharp)”. I have run them different lenght with same symbol, same data, same strategy settings, the only difference is the selection criteria. I have told Strategy Quant to save 4000 (instead of 500 by default) strategies and rank them for me. I have picked 4000 to have better statistical relevance and try to see differences.
Objective
1. I want to see if i get different strategies selected by changing the strategy selection criteria
2. I want to know how long i need to run Strategy Quant to have enough statictical relevant strategy pool. This is very important question for me.
Testing Criters
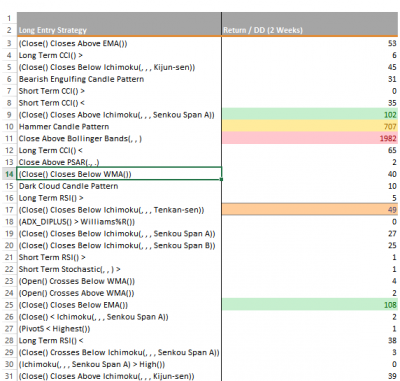
I have run StrategyQuant over 2 full weeks and picked “return / drawdown ratio” as criteria and had at the end 4000 different strategies. I exported all 4000 as Pseudo Source Code into 4000 different .txt files and coded a parser in c# which has parsed “LongEntryCondition” which is the Entry condition and uniformed. How did i uniform them? I have simply removed all numbers. So if one strategy had “LongEntryCondition = Close Above Bollinger Bands(20, 2, 0)” and another had “LongEntryCondition = Close Above Bollinger Bands(12, 1, 0.5)”, by removing the number we get “LongEntryCondition = Close Above Bollinger Bands(, , )” which is uniformed. Then i have counted number of long conditions they have used same uniformed rule. If we check left screenshoot you see that “Short Term CCI()>” rule was used in 0 of strategies but “Hammer Candle Pattern” was used in 707 / 4000 strategies.
Results
After spending weeks on this test i can clearly make several statements:
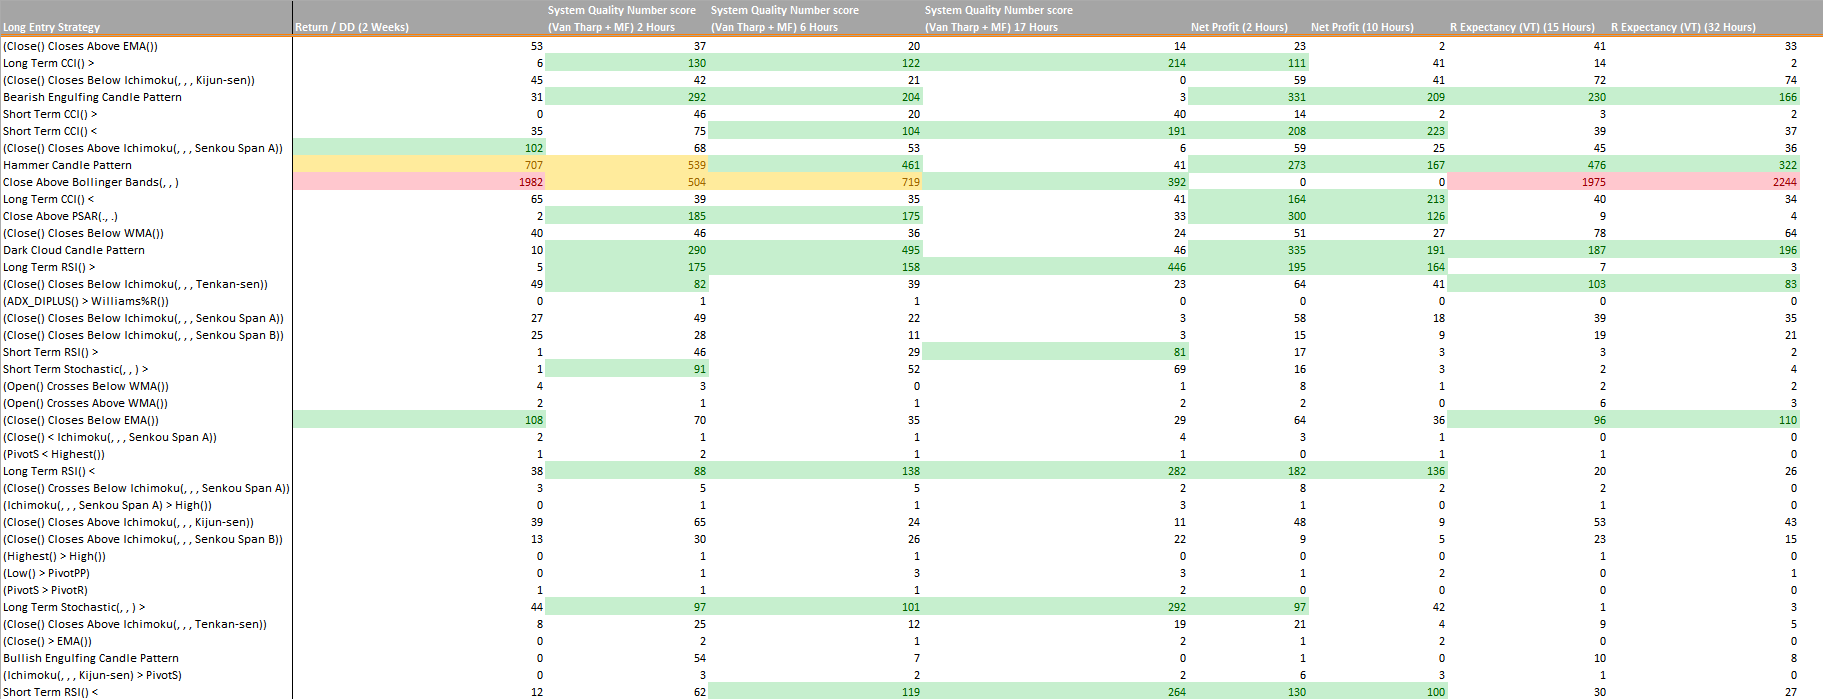
If you look at the big picture, selection criteria does not seems to have an effect. 4 Different selection criteria and 8 different runtime, we can see more or less similar long entry rules were taken and selected to be inside first 4000 and percentage of their weight in the 4000 is similar. I dont think we expect them to be exact same because we are using same data, setup but different selection criteria, they are roughly same.
If you look at “Return / DD (2 Weeks)” and “R Expectancy (VT) 15 + 32 hours” you see that red numbers (their relevance is very strong among 4000) are getting dominance. Why this might happen? I think this is a normal process, if you have pick 15 different indicators to choose from and in average they have 2.5 parameters and if we assume StrategyQuant picks the parameters randomly and if we assume the parameters value is in very rare cases over 100 and if we assume the resolution of parameters is by 1/100. 1 single indicator would have 100x100x2.5 different combinations = 25000 combinations. If we assume Strategy Quant uses 1..100 with resolution 1/100 to combine with single indicator, we can say 10000 combinations. If we assume SQ combines in average 2 indicators from 15 possible. There would be around 127 combinations x 10000 from static operations x 25000 from indicator we come to a combination of 31750000000. This calculation is too rough and does not reflect real nature of Strategy Quant, i am just playing the numbers to demonstrate the reason why long lasting searches end with “red” numbers….
In case of first test which took 2 weeks, we can assume that millions of strategies were tested. I have tested everything with Random Evaluation method, which means everything is random. Imagine if you run same test over 2 weeks and millions of iterations are over, the possibility that you will find very similar straties with similar criters. Imagine you have found “LongEntryCondition = Close Above Bollinger Bands(20, 2, 0)” and “LongEntryCondition = Close Above Bollinger Bands(20, 2, 0.1)” and “LongEntryCondition = Close Above Bollinger Bands(20, 2, 0.2)” and if exit is similar the results will be very similar, this again results that our selection criteria will also have very similar number. As example first strategy has “return / dd ratio” 3.04 and other one 3.05 and other 3.03. It is obvious they will be listed together.
Conclusion
1. Strategy Quant will list very similar strategies together and if you run it over months, results will be piled up with very similar entry rules. Is this what we want? I dont think so, we try to find strategies they are different. My recommendation is: do not run Strategy quant too long time, I have decided to stop random search after 20-30 hours from start and do evaluation. I have found this is a good time to look for results, otherwise results will piled up and you get only few different strategy ideas
2. I think that there is no perfect strategy selection criteria, this is a bit matter of sense and trust. My tests show that almost all 4 different criters came to similar hotspots with long entries. (see screenshoot and colored cells). I have run “return / dd” intentionally too long, i am almost sure if i ran it only 2 days, i would have similar results like others.
3. You can download the Workfile in Excel format and analyse it yourself… From 698 different long entry strategies top 20 in excel has bigger presence in the list. I assume if a long entry criter has less then 10 strategies from 4000, i assume this long criter might not be very relevant! That is the idea why i have started making these tests. I wanted find hotspots. I believe hotspots can help you to identify edge. For example in our chart, “Dark Cloud Candle Pattern” has strong relevance on almost all different criters. I can say that i can pick 1 of these 200-400 strategies they contain “Dark Cloud Candle Pattern” and trust it. Of course it is different story which one of these 200-400 is to pick, this requires another big blog entry. Pick the one with your favorite criters, there is not a simple way to pick.