+1.954.4163300
 Mon.-Fri. 10:00-18:00 EST
+1.954.4163300 Mon.-Fri. 10:00-18:00 EST

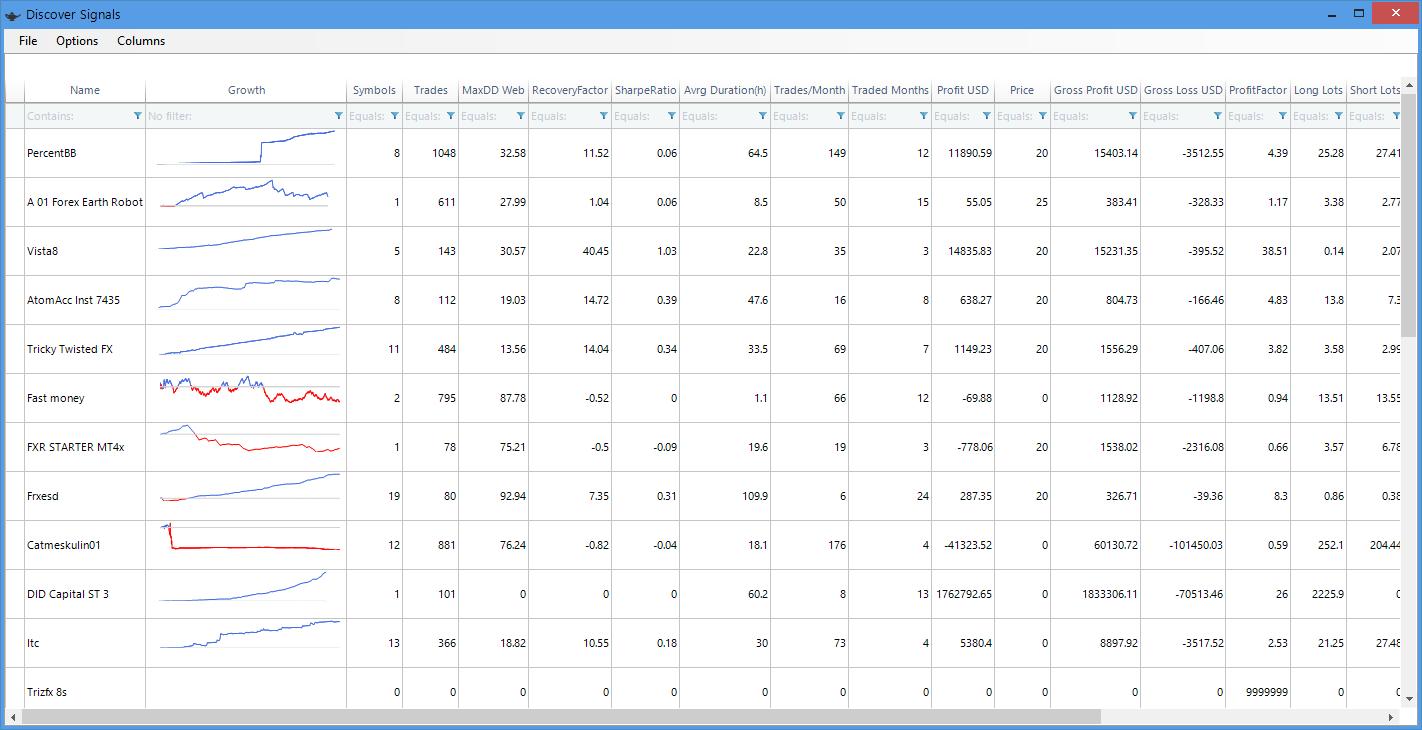
SA is a tool designed to analyse History files provided at mql5.com Signal Service. SA is able to analyse the Signal from different perspectives and make sure you dont waste your money and time!
We have designed a tool to analyse Signals offered at mql5.com/signals. This tool is able to display Trades from different perspective. For now we support mql4 signals.
SA is able to analyse History CSV Files from https://www.mql5.com/en/signals/mt4. You login into mql5.com with your account, because you need to have a valid account in order to download History CSV Files. SA is able to analyse them.
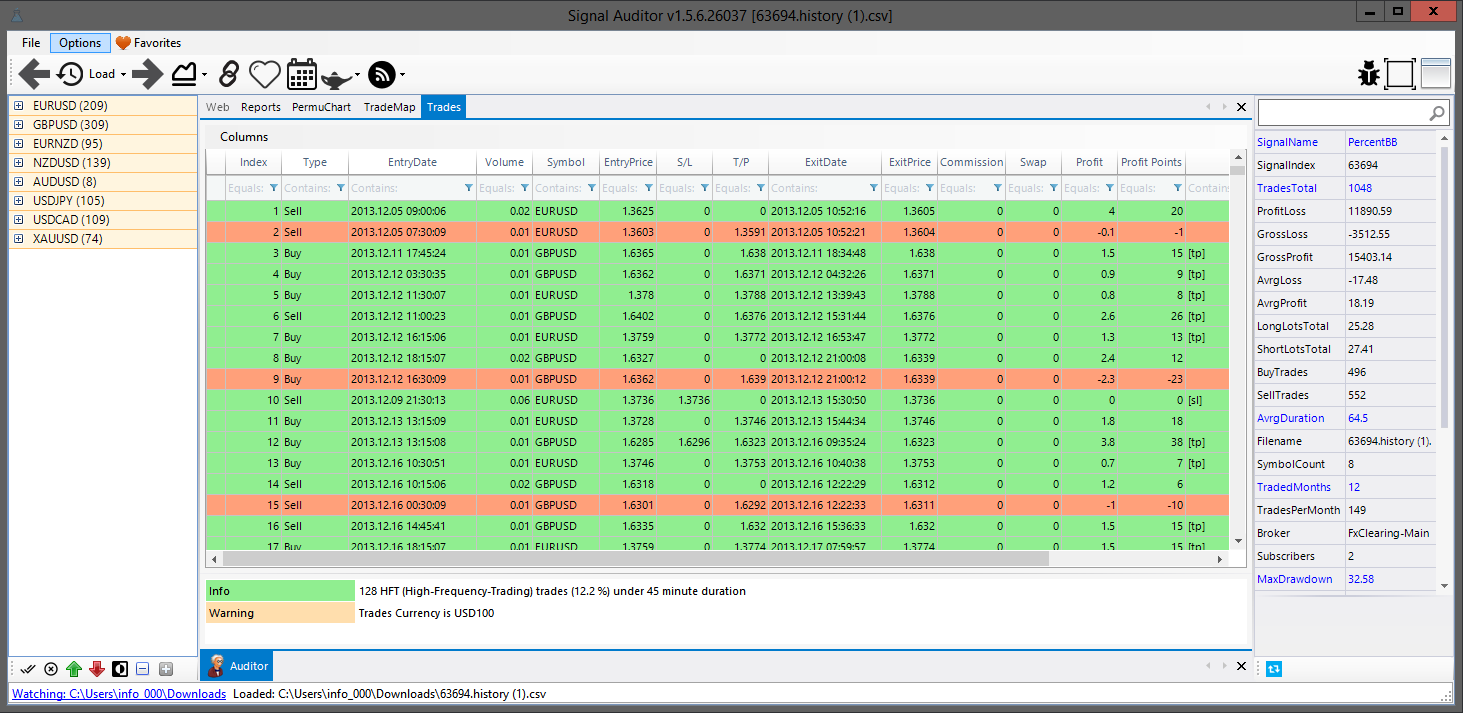
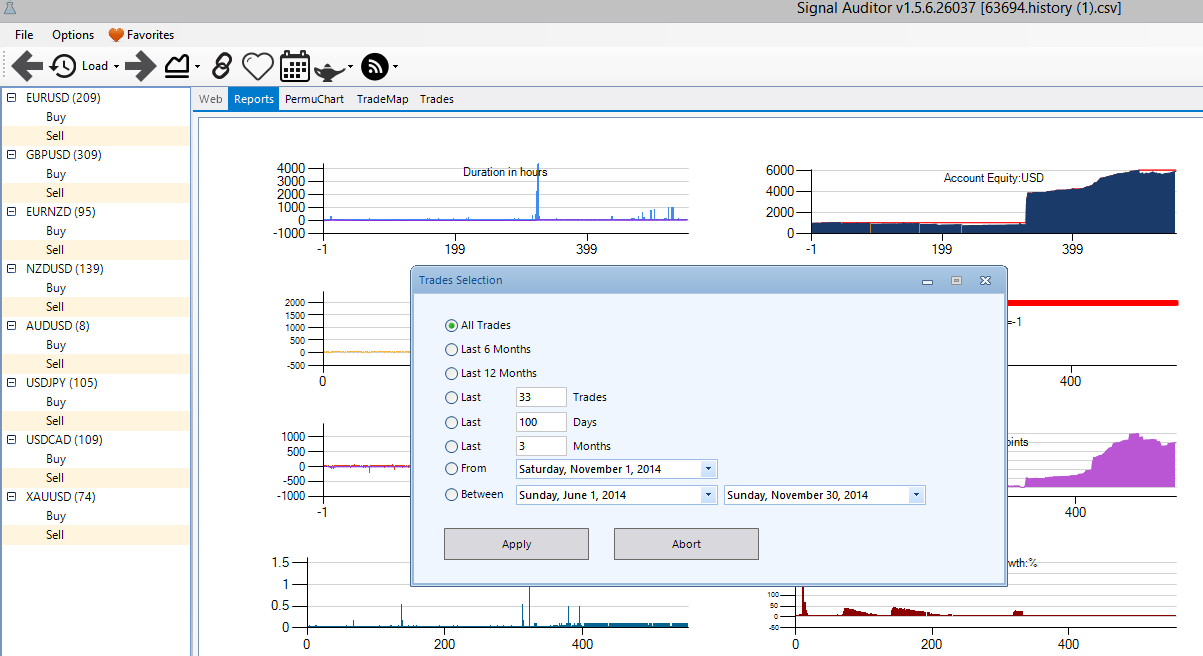
You download History CSV file by clicking "Export to CSV: History" link, you find this link near Trade Details. We recommend to watch 1.5minute video to get started. This video shows you everything. After you have downloaded CSV File you can simply drag & drop this file on to SignalAuditor Window (we assume you have it already running). There are 2 other methods how to load Trades to analyse, please watch the video.
SignalAuditor is an ongoing project and is being developed, some of features are:
Other videos will follow
Beta Testing is in progress. In this period everything is FREE.
Download SignalAuditor.exe and double-click to start it. We have embedded everything into 1 single file. You dont need to install, just download & start
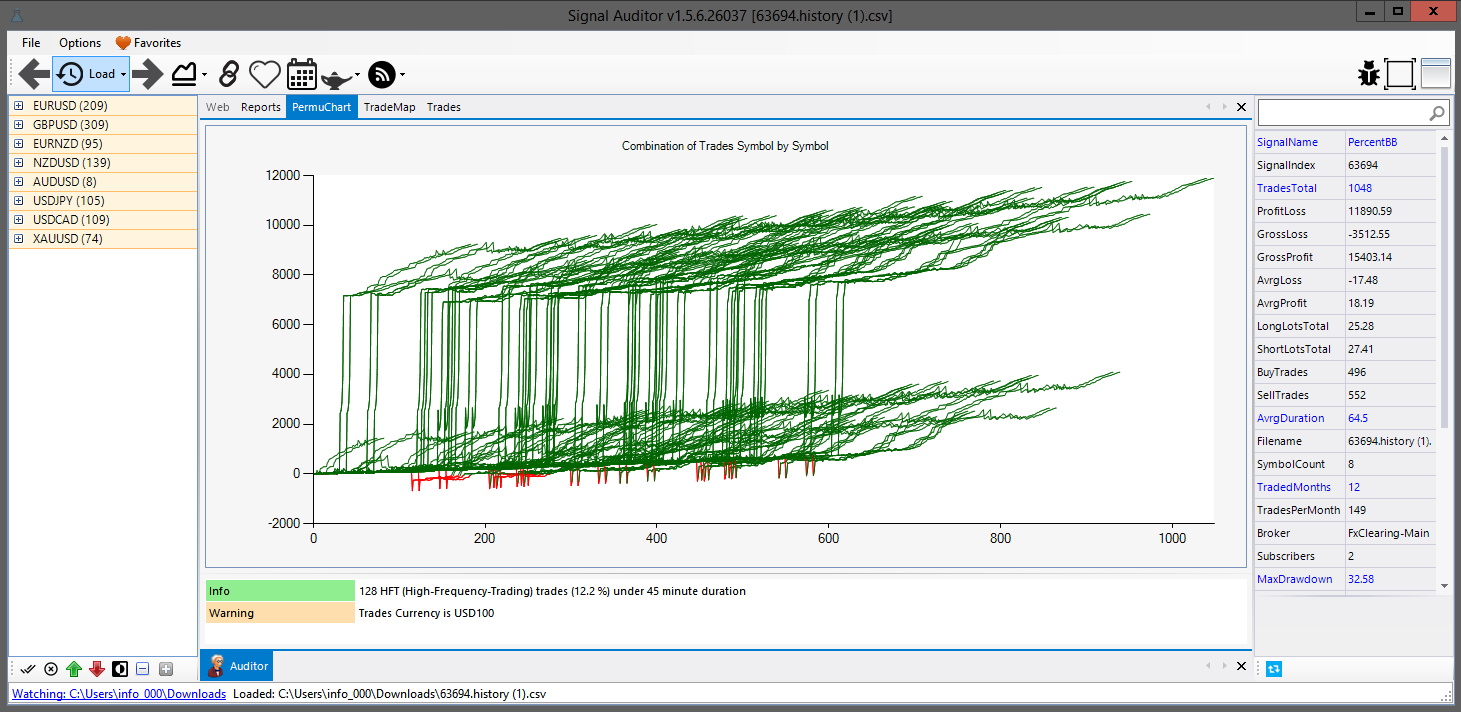
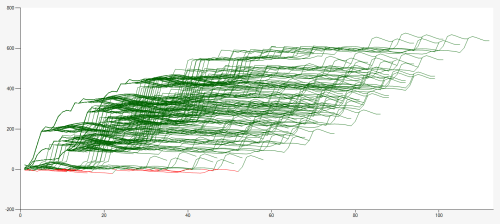
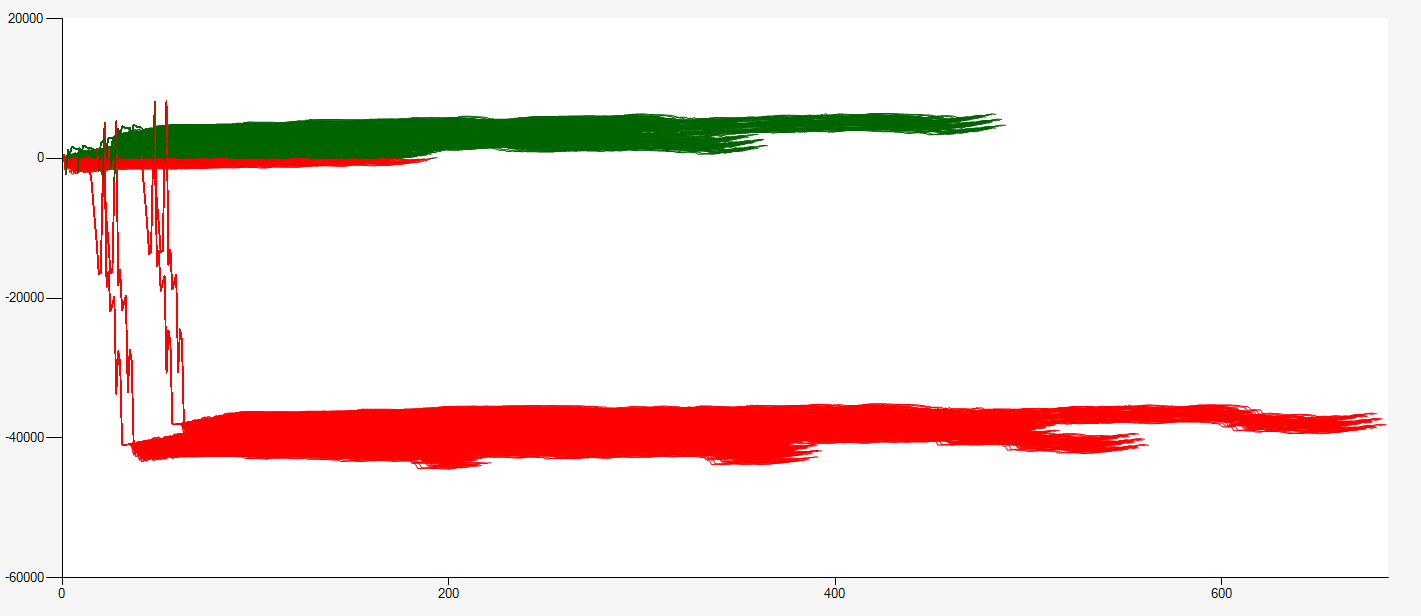
If a Signal Provider streams trades, you never know how reliable this signal is, his/her decissions might be random nature. PermuChart is able to draw Growth Graphics in different combinations of Trades with different Symbols. If a trader is providing signals from 5 Symbols, you will visually see what would have happened if this person would have trades Symbol1+Symbol2, Symbol1+Symbol3, Symbol1+....+Symbol4, ..., Symbol1+Symbol2+Symbol3 etc. This graphic is designed to see possible randomness in trade combinations. You dont see which combinations are doing better and which are not BUT you will see a global picture about things, this is more reliable than digging into detail.
In following picture you clearly see that this trade signal seems to be reliable, at least you know that different combinations does not change much on success. You see almost all results are Green (positive) but Profit varies between +100 and +600! Visually we can see that average is around +300 and this gives kind of trust.
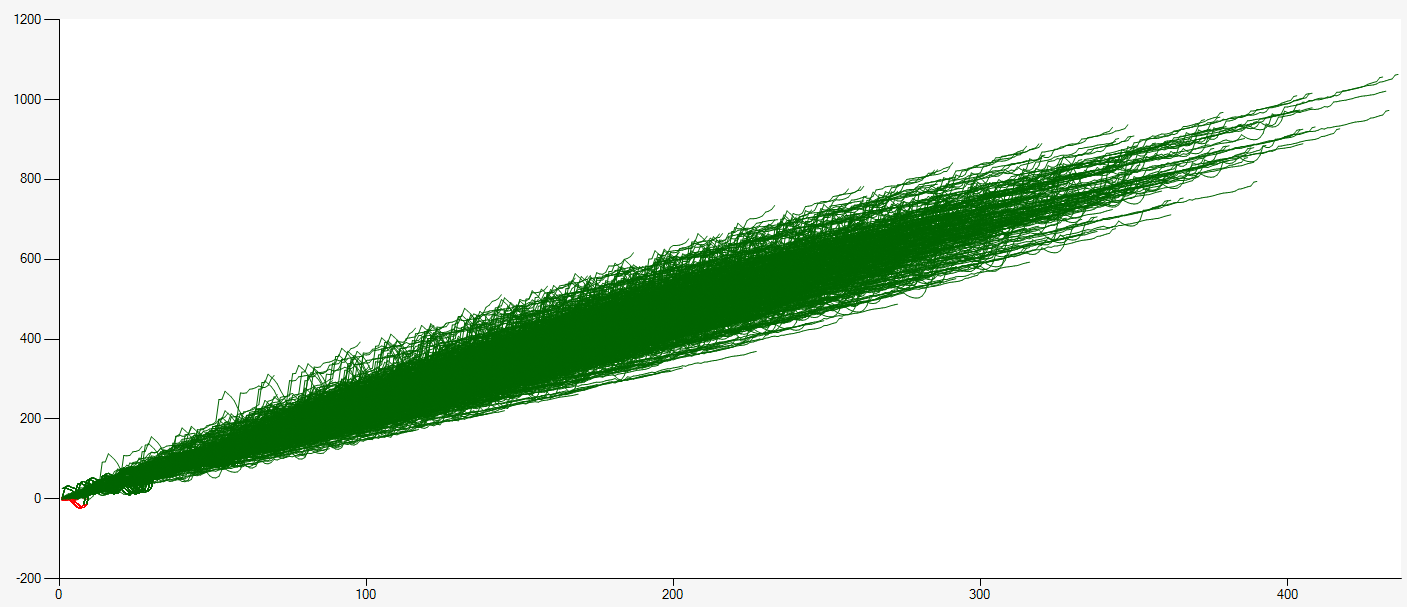
Following example says us that this trader is obviously scales his/her trades between different symbols, regardless which combination we draw they are proportional to eachother. This shows professionalism.
Here is another example: Here is the profit -41323.52 USD in real world. We see in PermuChart that this guy could not be helped with his trading style!. Best possible scenario would be around +5000$ but the possiblity is like 1/3, all other variants lead to minimum loss of -38000$ and more.
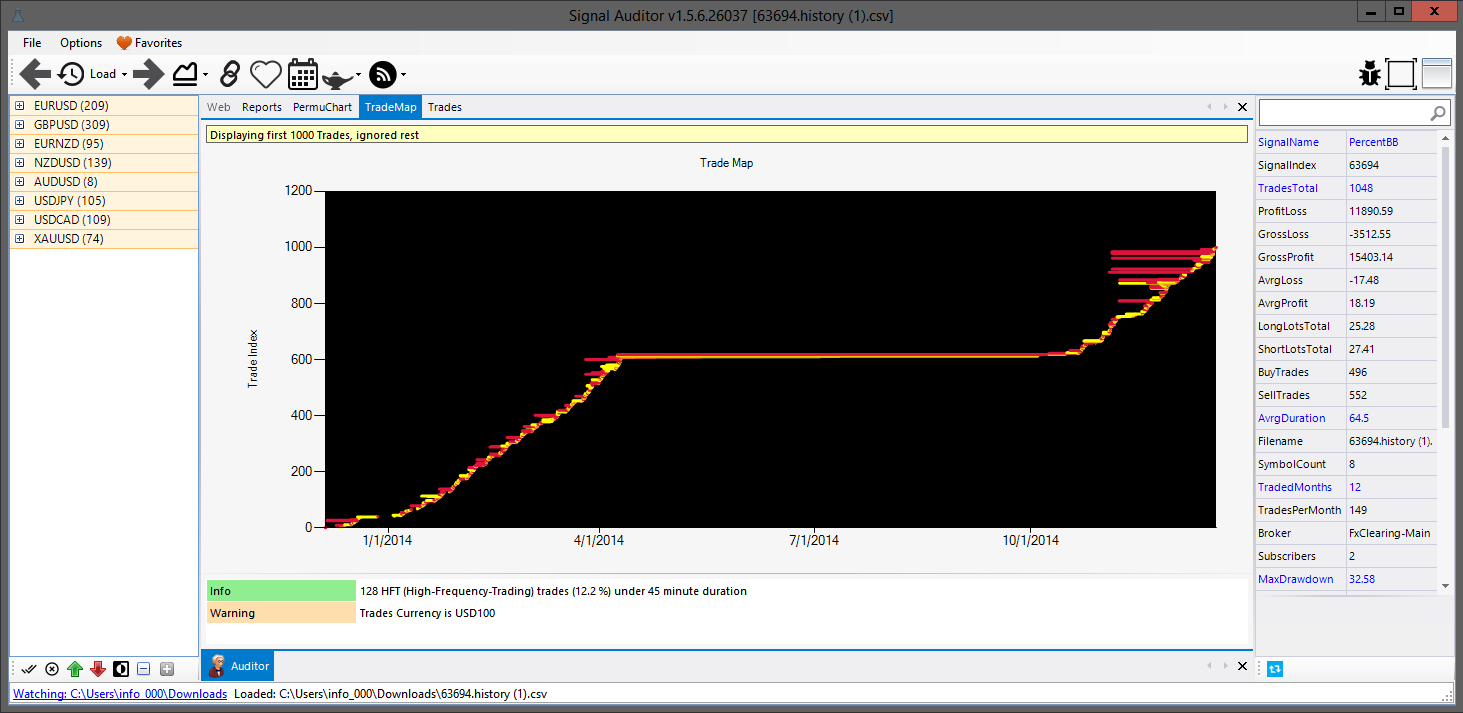
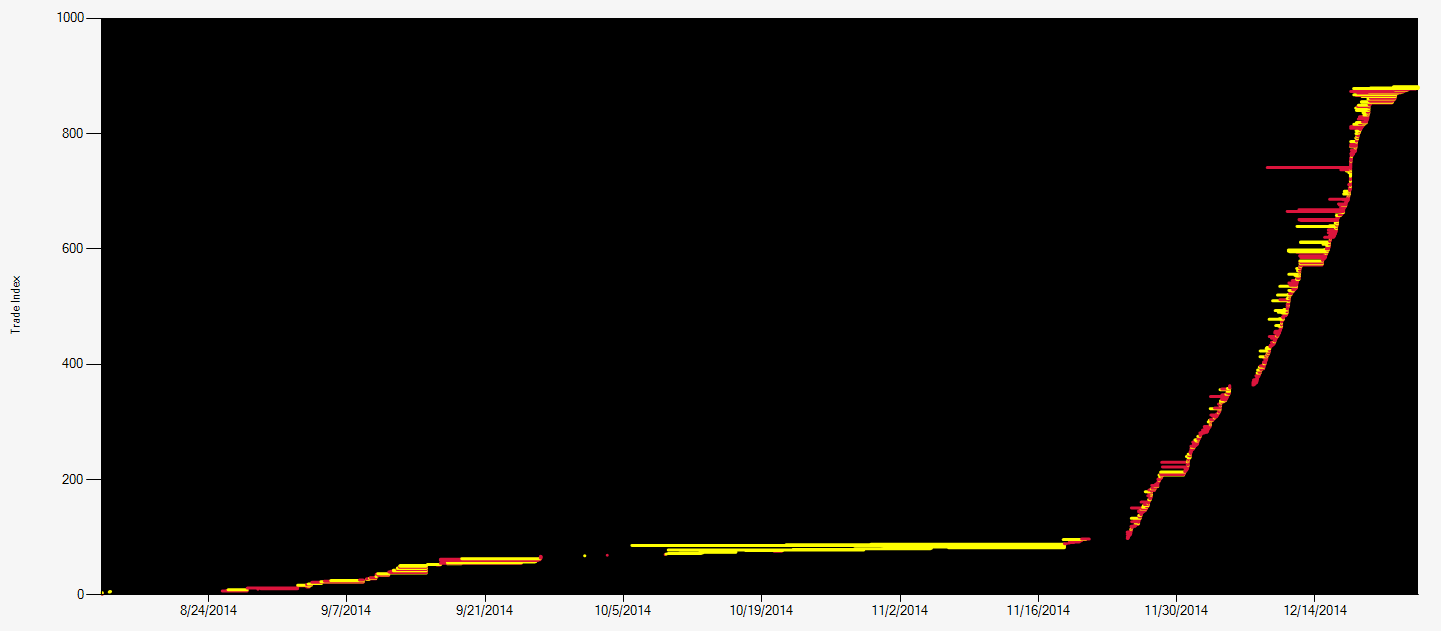
TradeMap aims to visualize Traders Trading Style. As X-Axis is the Date Signal Provider has initiated the trade, Y-Axis is the index (order) of the trade, Yellow lines are Buy Trades and Red lines are Sell Trades. You can see by length of lines the duration and compare trades with eachother. You can read many things from TradeMap, it is just matter of time you see new pictures. TradeMap is made by Fx1
Analyse: This trader has started with Buy & Sell but then he/she has stucked over months on single trades! (see middle of chart), obviously this trader has waited till the market has turned :(. See and compare trades in the middle with the ones at beginning and end of chart, Obviously trader has changed Trading Style or Algoritm or this Trader is deciding too volatile. Most important thing to see here is that he/she has waited 6 months with several trades!
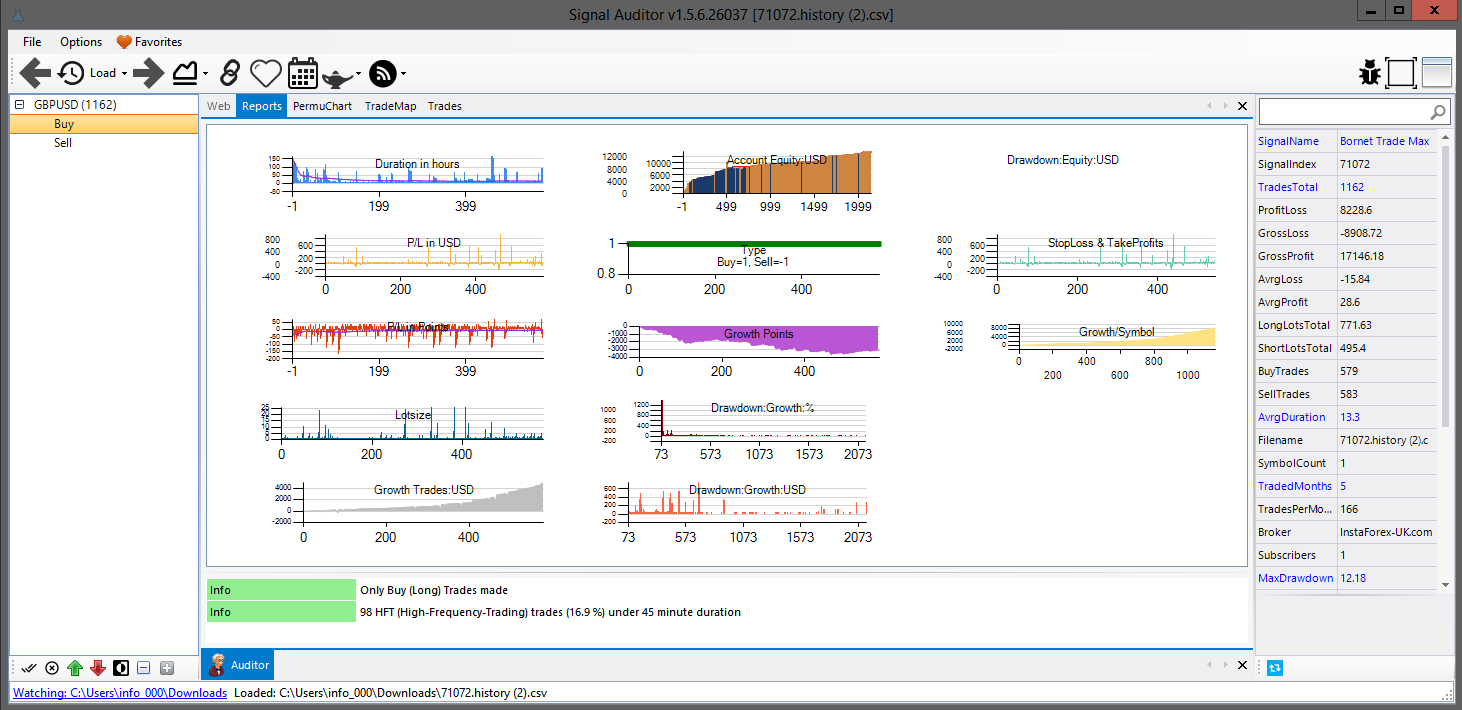
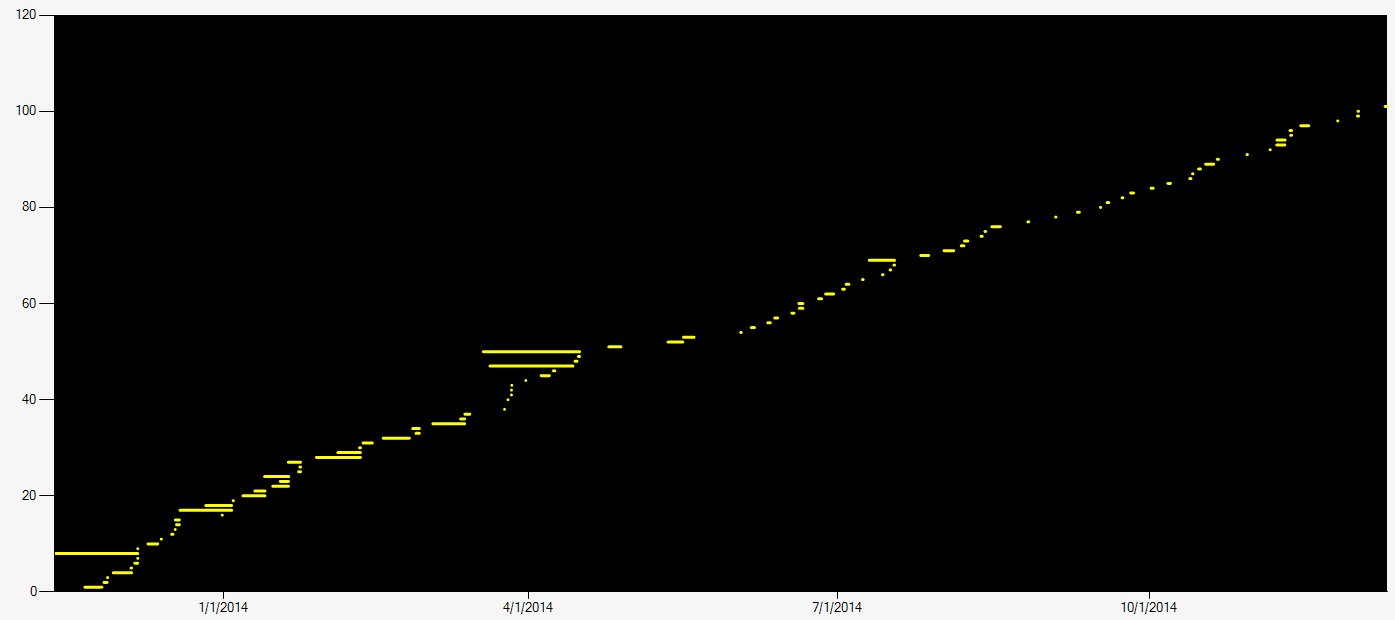
Analyse: Only Buy side trades, almost all of them are short, there are few exceptions they took around 2 weeks. Another important fact here is: this trader does not open trades while other trades are engaged (at least most of time). As you clearly see the trade lenght has decreased in last months.
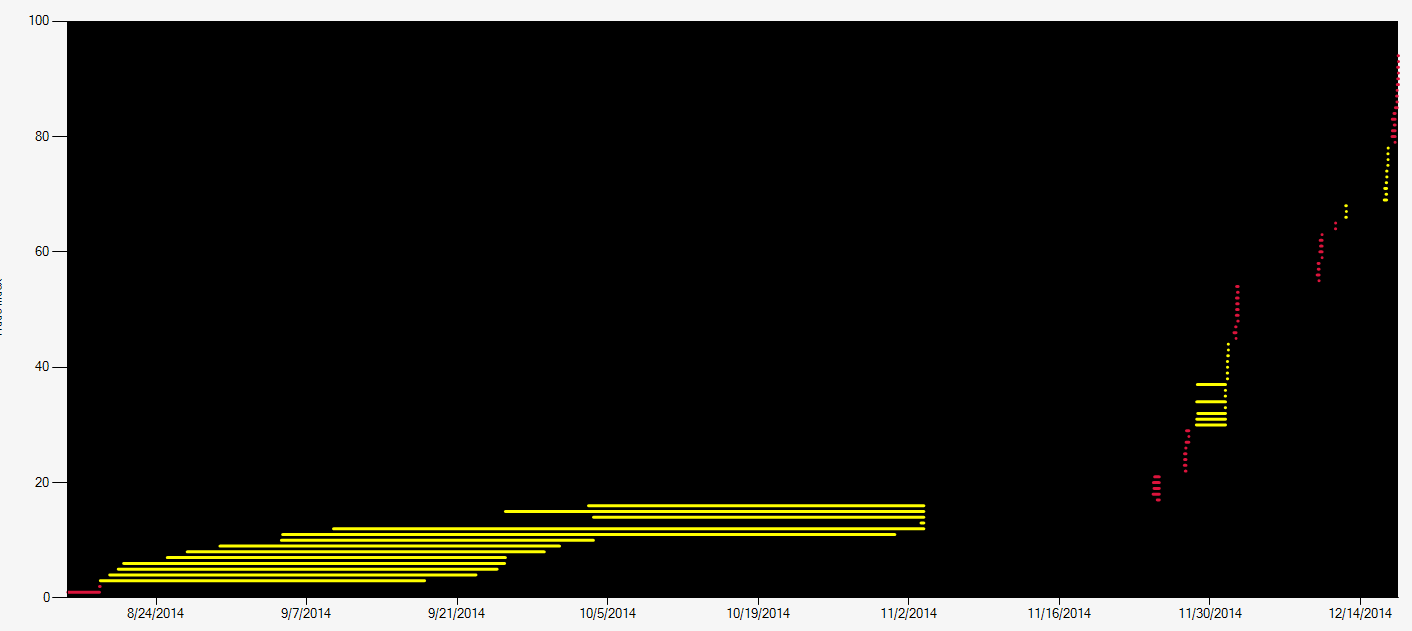
Analyse: Clearly visible trading style changed dramatically. First Half Trader was pyramiding over weeks!!, Then he/she has made a pause(probably was in minus), then started with different approach!
Auditor is analysing very obvious things on Signal. For example it will say you that Signal does not use StopLoss at all, or it will tell you HFT (High-Frequency-Trading) and its %, it will warn you if last trade was made > 14 days etc etc. Audit Report is in 3 Severity levels: Info, Warning, Serious. We implement new Audit Reports, we recommend you to read them carefully.
We have Report Bug function implemented in SA. Please use this function to report us bugs. If you cannot start the Application, you can contact us at support@fx1.net with all Details. Please make sure to mention the problem in detail, we cannot see your screen, we need to understand the situation in order to help you.
Warning SignalAuditor does not recommend you any Signal or Trade. It is a tool for you to analyse Trading Signals throughfully. You make all decissions which Signal is to trade.Our company is not responsible for none of these decissions.
| Version | Description | Download |
|---|---|---|
| 1.6.2 |
|
Download Version 1.6.2 |